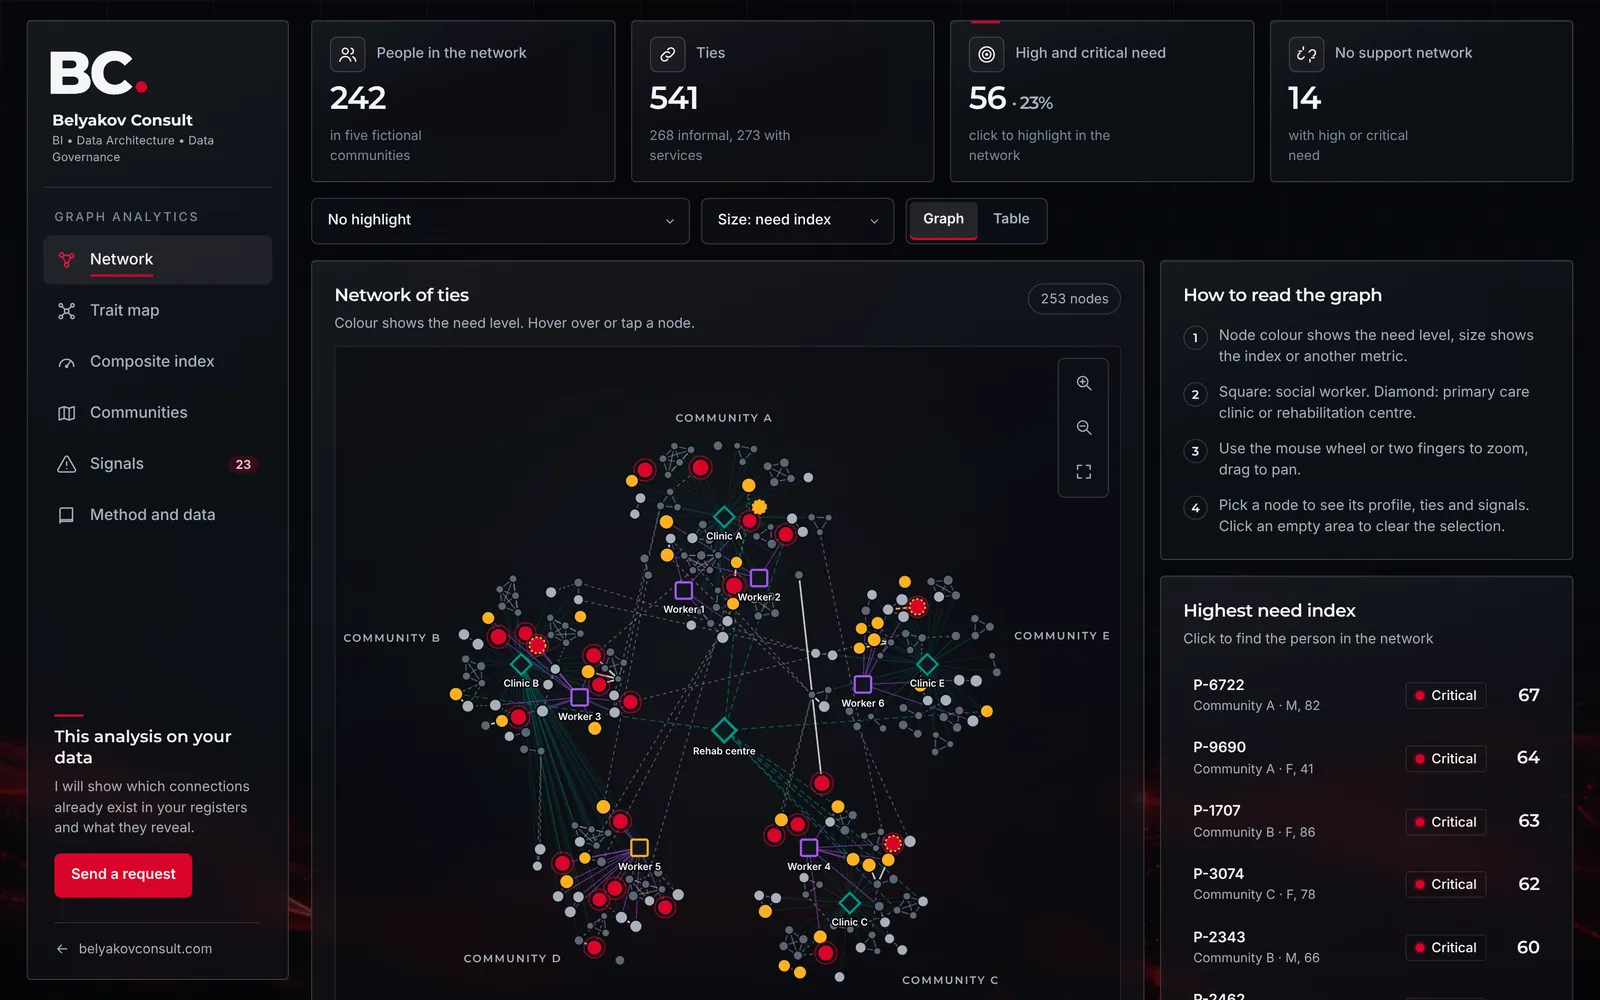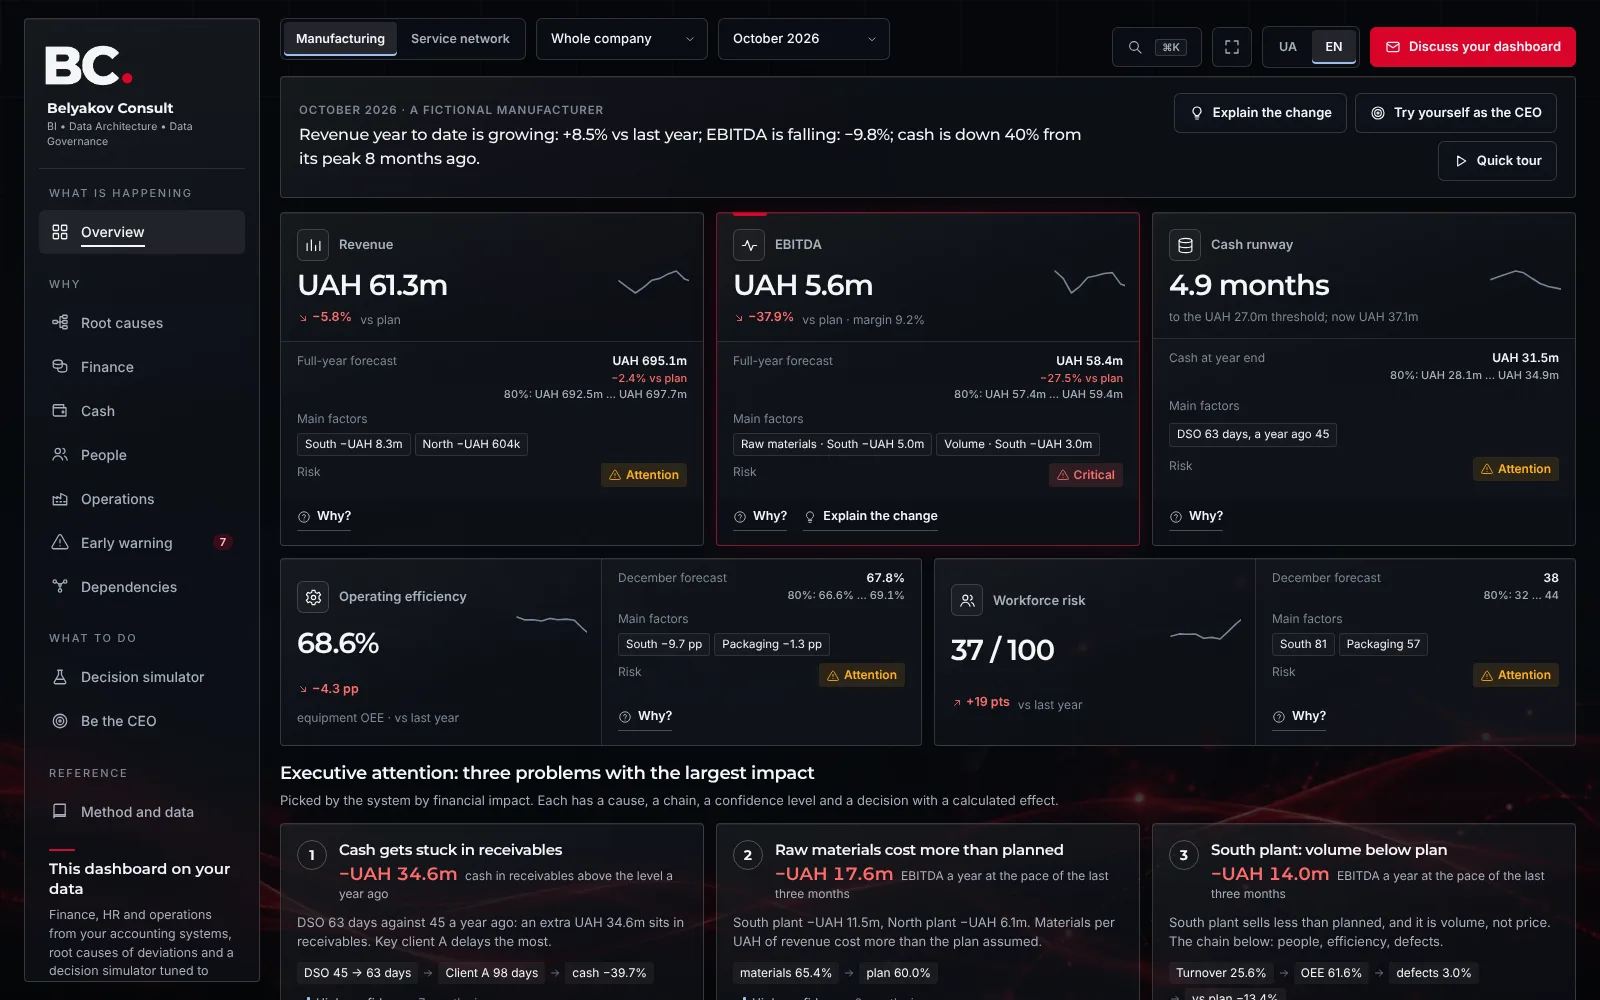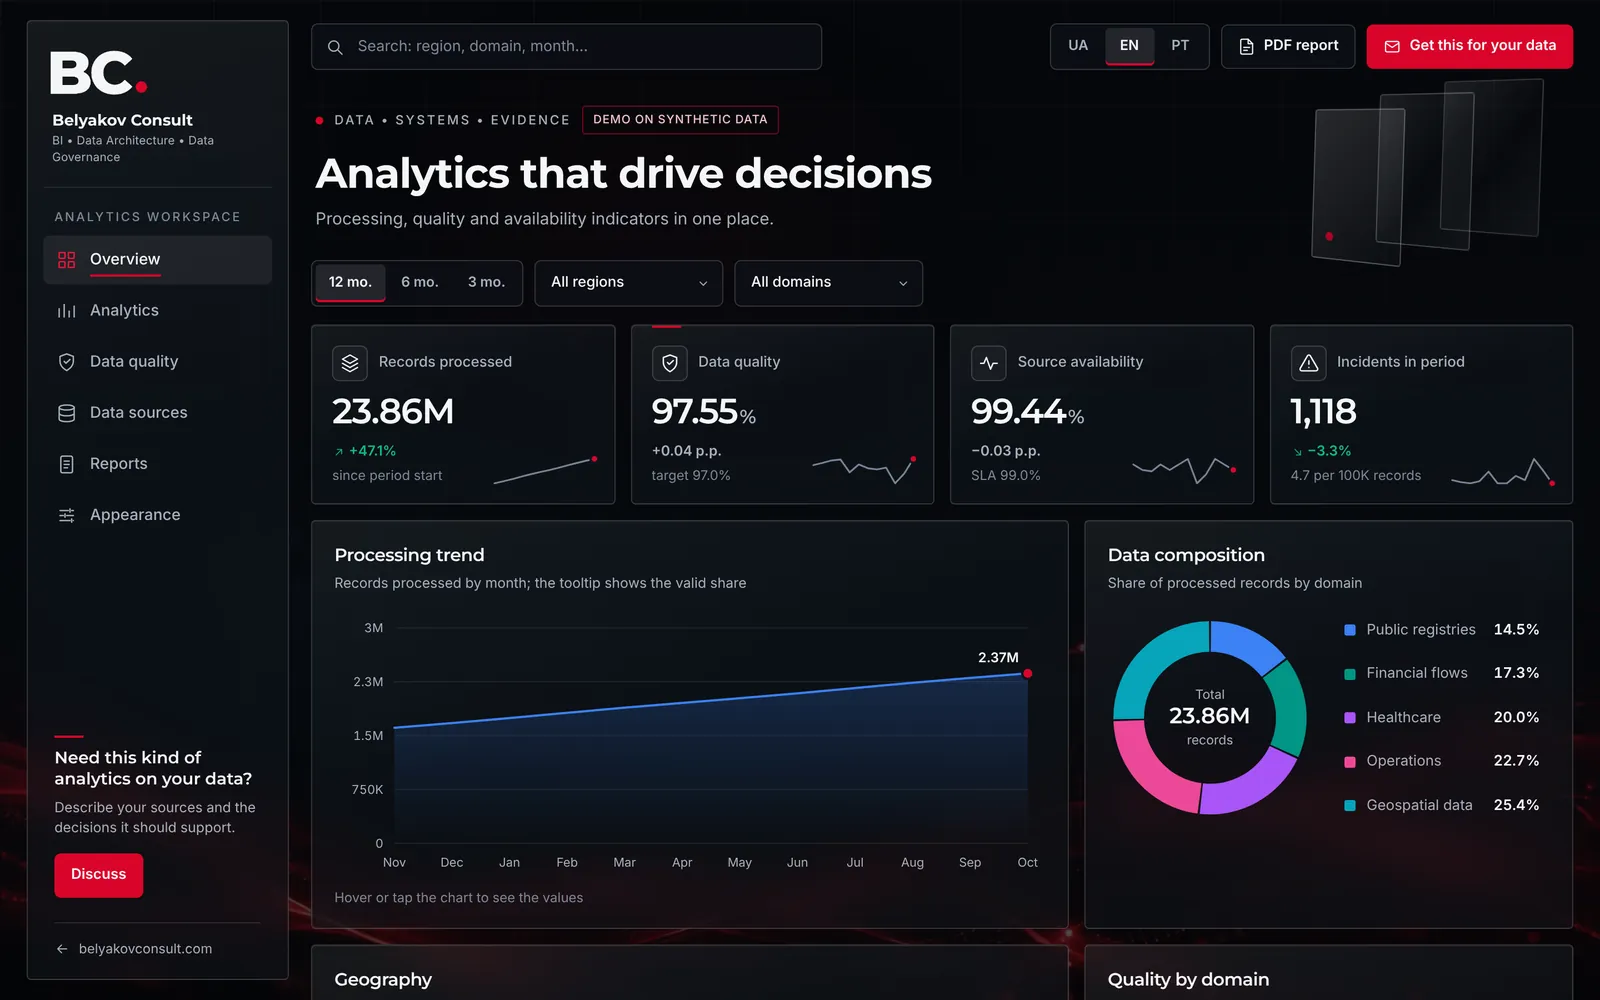








Communities
Analytics for a community’s territory and services
I show on a map and a 3D model where people live, how they reach services and what changes if a school closes, a clinic opens or the river rises. Decisions rest on calculation, not on gut feeling.
Typical tasks
- Access to service centres, clinics, schools and transport routes
- Flood zones, cut-off villages, siren and telecom coverage
- Where to build new shelters, clinics or other facilities
- Climate, soils and erosion for land planning
See it now
- DemoTransport accessibility demoIsochrones to primary care, a hospital and a service centre, population coverage, catchment areas and network scenarios.
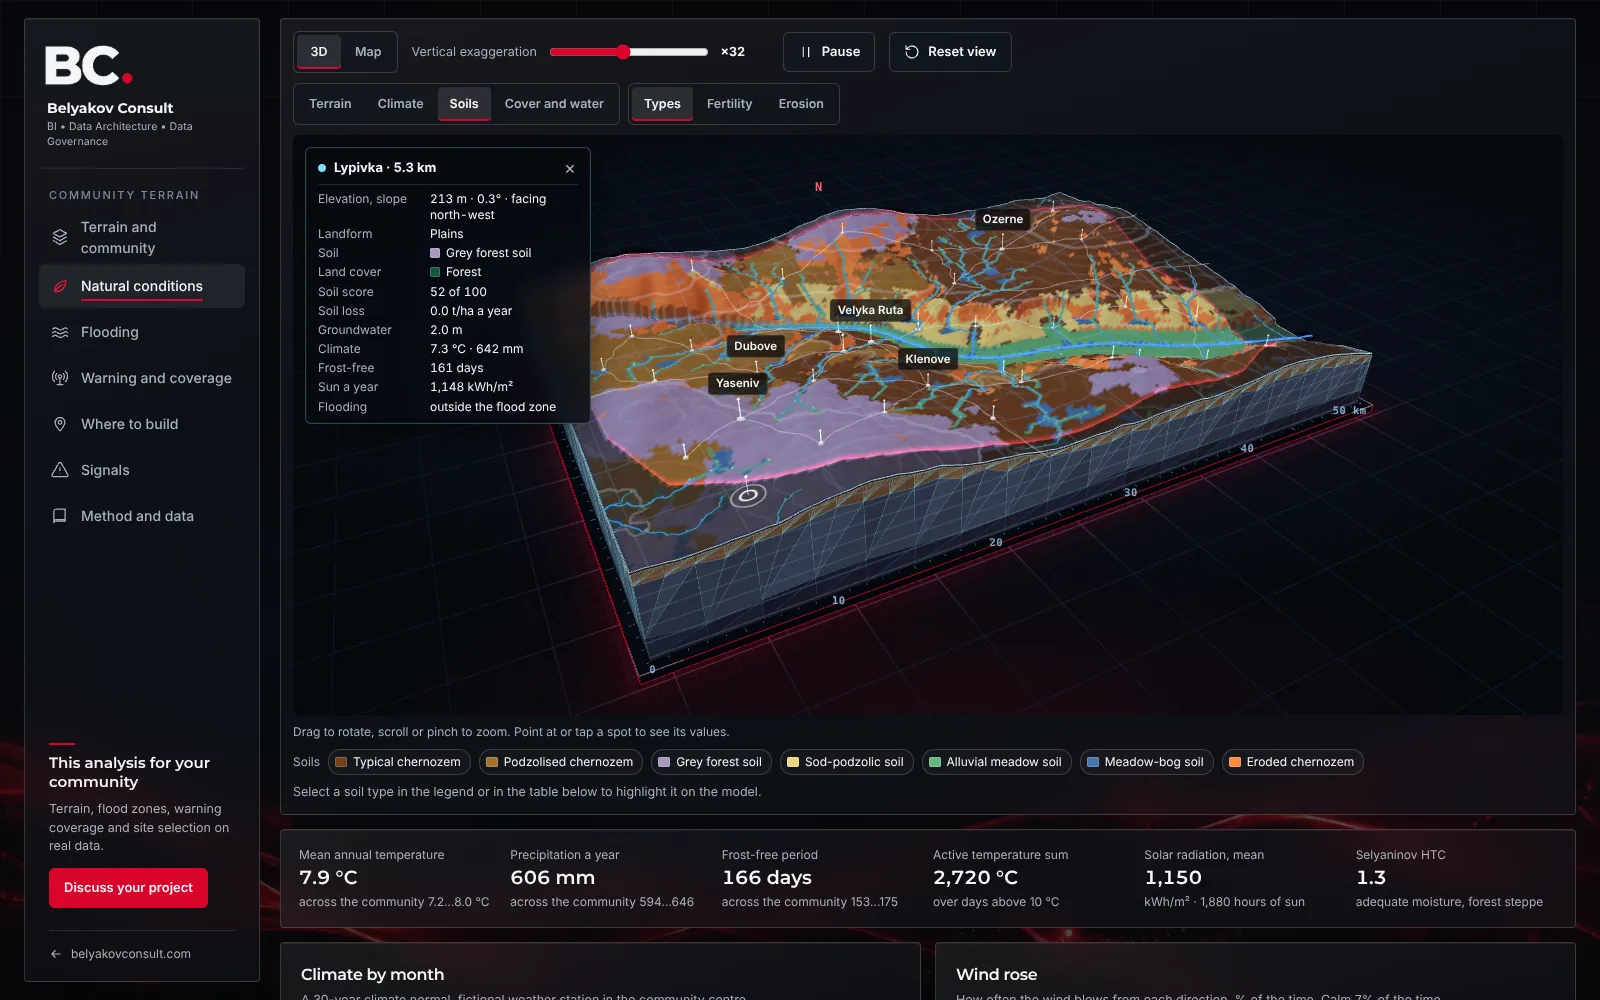
- DemoCommunity terrain 3D demoCommunity terrain in 3D: flood zones, warning and coverage, climate, soils, erosion and groundwater, site selection for new facilities.
- DemoCommunity digital twinA community passport that updates from registers: 50 indicators with data status, every facility on the map, the real resident count and school, blackout and flood scenarios.