
A data quality dashboard usually shows one big number, and it is almost always green. I built a demo that shows why one number says very little and what to show instead.
The demo runs on synthetic data: 360 records, 12 months, 6 regions, 5 domains. I planted a few problems on purpose so there is something to find. The indicator logic is the same as in real projects.
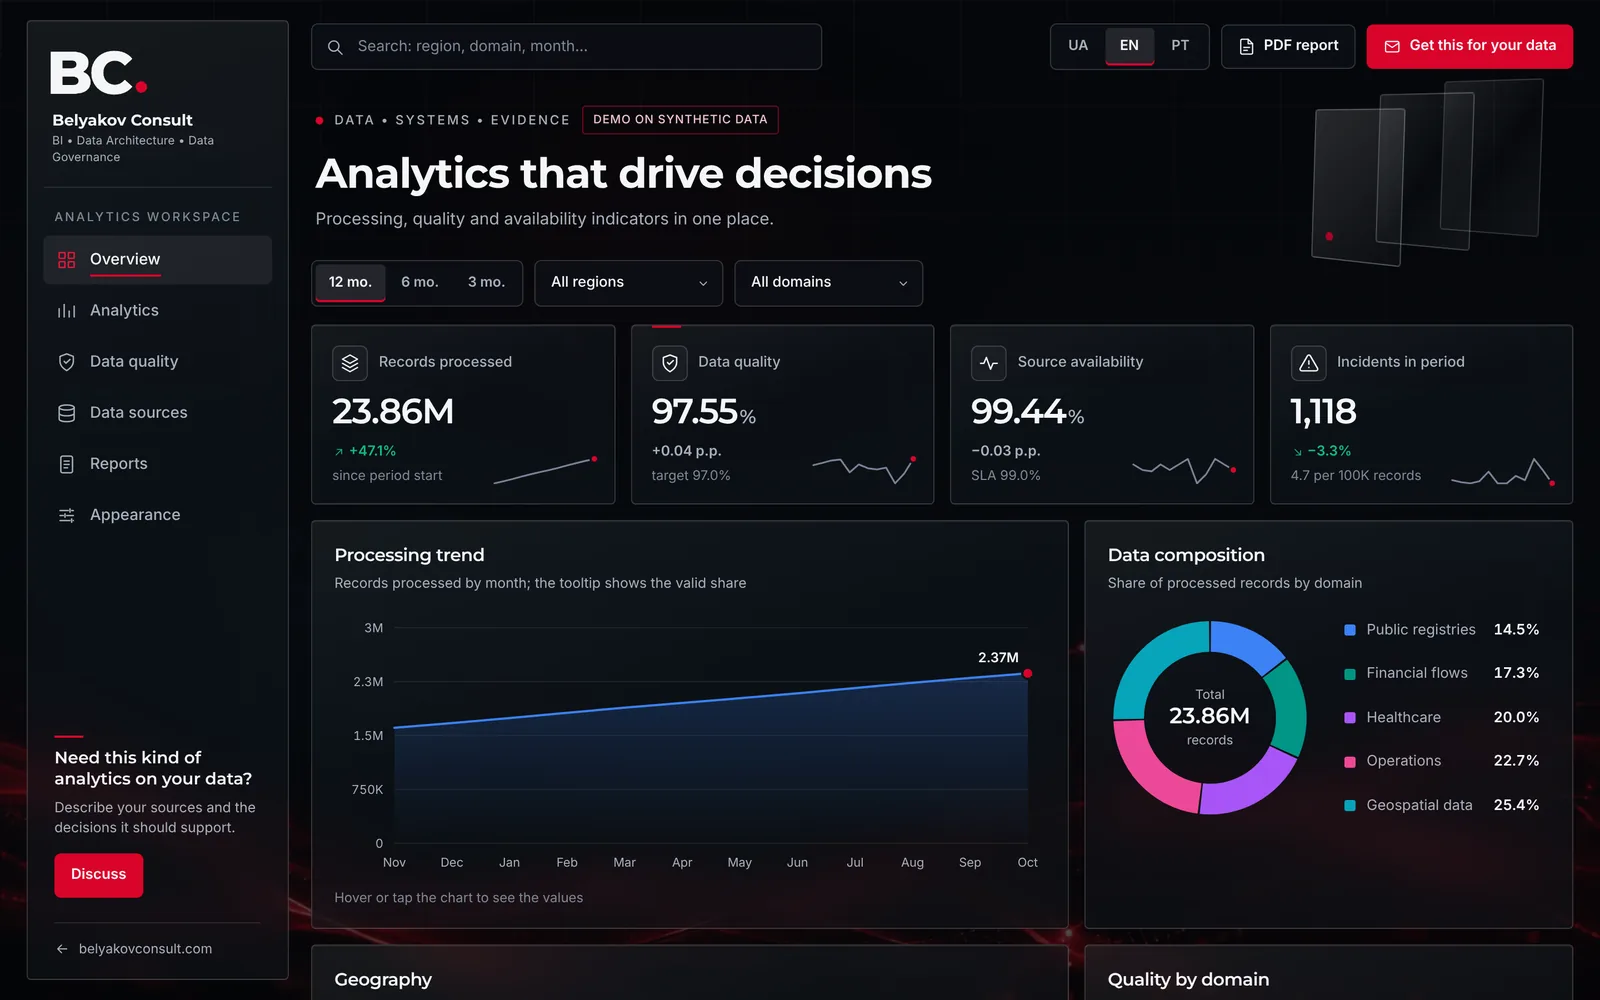
Four numbers on the first screen
Four indicators are enough for the first screen, as long as each has a written definition:
- Records processed. Volume gives the percentage its weight: 97% of a thousand records and of a million affect very different numbers of people.
- Data quality. The share of valid records: sum of valid / sum of processed. It only works when it is written down what counts as valid.
- Source availability. Whether the data arrived at all. I keep it separate from quality because the causes and the owners differ.
- Incidents per 100K records. The absolute count depends on segment size; the rate lets you compare a large region with a small one.
The average hides the problem
In the demo, overall quality is 97.55% against a 97% target. Green. One level down, the picture barely changes:
| Aggregation level | Quality |
|---|---|
| All data, full year | 97.55% |
| Odesa, all domains | 97.43% |
| Healthcare, all regions | 97.41% |
| August, all segments | 97.45% |
| Odesa × Healthcare, year | 96.87% |
| Odesa × Healthcare, August | 93.80% |
The drop to 93.80% with 25 incidents (usual months have 1 to 4) appears only in the last row. The example is illustrative, but the mechanism is real: every aggregation dilutes a problem with the normal data around it.
It is like a class average: 4.5 out of 5 will not tell you that one student failed the test. The analogy is imperfect, because in data the "student" is thousands of records from one segment, and their error reaches a decision all at once.
So the demo has two things instead of one number: a region × domain matrix coloured by status, and a list of exceptions at the month × region × domain level, sorted by severity.
The data owner sets the target, not the dashboard
In the demo, the quality target moves with a slider. On the same data, a 96% target leaves 5 of 360 segments below it, 97% leaves 94, and 98% leaves 256.
The threshold changes the picture by an order of magnitude, so it is a management decision, not a default setting. The data owner makes it together with the people who decide on that data, and writes it into the methodology.
Sources separate from quality
Another planted case: Kharkiv × Geospatial data, June. Records are 98.20% valid, so the quality chart is all green. Yet the source's availability is 96.40% against a 99% SLA, and latency is 410 ms against 250 ms.
The source's average availability over the year is 99.06%, formally above the SLA, so the failure disappears a second time. The demo has a separate page for sources: availability, latency, refresh frequency, integration type and owner.
A report people read
Managers rarely open a dashboard, but they read a PDF in their inbox. So the report is built in one click from the current filters: key indicators, insights, structure, the quality matrix, exceptions, source health and the calculation methodology.
The methodology inside the report matters: people who did not calculate a figure can still check it. The PDF is built in the browser and no data is sent anywhere. You can also upload your own CSV in the sample format.
How to check your own dashboard
- Does every indicator have a written definition, including what a "valid record" is?
- Can you get down to a month × region × domain segment in two clicks?
- Who set the quality target, and where is it recorded?
- Can you see source availability separately from record quality?
- Does the report include a methodology that lets you recalculate the figures?
If the answer is "no" to two of the five, the dashboard reassures more than it controls. More on the approach: Data Quality and Business Intelligence.
The demo is open: play with the filters and download the PDF. Does your dashboard show averages or segments?